Qt GUI for Autobright
I have been working with the combination of the ambient light sensor and the display control software for a while, see the tag ColorHug. After the rewrite I had the software in a modular fashion and had a reasonable wrapper for the sensor, as well as for the display control. The problem still is the model that translated in between. And to improve the model, I needed to gather data. So I have been collecting data tuples of date and time, manually set brightness and sensor reading throughout my work and leisure time at the computer.
In order to take these measurements, I wrote a little GUI. And in the first iteration I just used Streamlit, because I had some experience with that. And the GUI looks reasonable. The one big issue with Streamlit is the model of state, though. It works reasonable for certain things, but it doesn't really work well for things that need persistent state. And the sensor needs initialization just once, but Streamlit would re-create all the objects. And that made it a bit cumbersome to use.
In order to get around that, I started with Qt and PyQt in particular. With that I can use both the amazing Qt library to build my GUI, but I can also use Python as a programming language. And with that I managed to build the first Qt version of the measurement program.
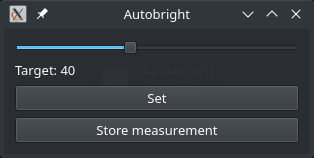
The usage of that is quite easy. I move the slider to a value that seems reasonable. Then I use the set button to set all the screens to that value. And when that makes sense, I click on store measurement to, well, store the measurement in the file.
I have also started a little configuration file such that I can set the I2C devices per machine that I use, such that I can have different ones for my work and personal laptop. This time I whimsically chose TOML, and this is how it looks:
[ddccontrol]
devices = [7]
Making sense of measurements
The next problem is to create a decent model that translates the measurements of the sensor into brightness values for the monitors. The data looks like this:
| datetime | reading | brightness | |
|---|---|---|---|
| 0 | 2021-11-17 09:16:27.733000 | 359 | 11 |
| 1 | 2021-11-17 12:43:34.860000 | 279 | 9 |
| 2 | 2021-11-17 12:50:02.146000 | 273 | 8 |
| 3 | 2021-11-17 14:17:43.697000 | 291 | 7 |
| 4 | 2021-11-17 14:42:29.204000 | 197 | 6 |
And when one takes a look at the data, one can already see that there is a big amount of noise there:
There are a few confounding things that I know of:
- I use the redshift functionality, so my screen gets gradually turned red when it becomes dark outside. The software does that by making the blue colors darker, and therefore creating this shift towards red. But it makes the overall brightness go down, so I need to correct the brightness. Including the time will likely help there, once I have a model for the amount of redshift that was applied.
- Most of my programs are now white on black (dark mode). In general I want slightly higher brightness values when I mostly work with dark programs. So when I use my IDE to write code, the brightness will be up a few points.
- The sun sometimes shines on the wall behind me, causing a diffuse reflection on my screen, although the screen itself isn't hit with more light. I correct for that, but I don't see how I could show that in the model.
I like the way that Android does it. It adjusts the screen automatically, but as a user I can give a certain bias. With my software I want to do the same, and also include a manual mode. This way I can always set the screen like I want, but also have the automatic mode present.
The redshift part seems to be the one that I can work around. I have added a color-coding for the time to the plot to see whether patterns emerge:
But it is not so clear-cut. This can also be because due to seasonal shifts in the time of day where the sun rises and sets. I would need to get the redshift formula. This can be inferred from the solar.c in the Redshift implementation. That seems to be quite complicated, it works with the angles of the sun. I might be able to implement that, but then I am not sure how much of an effect this has. I might do that later.
The data is quite noisy, I have added one round of LOESS to smooth the data. I have color-coded the weight:
The smoothed version is not good to predict stuff. Instead I try to pick a couple of points to use a quadratic interpolation:
This interpolation can be generated using a handful of points, which are then put into the configuration file:
[spline_model]
x = [0, 200, 400, 500, 700, 900, 1000, 1200, 1500, 3500, 6800, 9000]
y = [0, 7,   15,  21,  24,  30,  33,   34,   40,   70,   90,   100]
Not really viable
But in the end it turns out to be not really viable, and due to many different reasons. The brightness sensor sometimes is unrealiable, it just doesn't start up. I haven't figured out why that is the case. Then the ddccontrol utility doesn't always work. Perhaps it is a bit hard with the USB-C dock. Or my displays are getting old and unstable. The main display sometimes doesn't report the maximum resolution, so perhaps it's time for a new one.
And on top of that, there is so much spread in the desired brightness that the automatic setting doesn't really work so well. Perhaps my position of the sensor is not good. Perhaps I would need to take into account the different screen contents in order to get it better.
In the end it is nice, but the current state is that it is so brittle and cumbersome that I find manual adjustment of the screens less pain.