Reproducing a Melody the Physicist Way
I regularly listen to trance music, a genre within electronic dance music. It is more melodic than techno. In 2001, Luna Park had created the Space Melody (Spotify link). There is a melody in there, which other artists have used in another track in 2020, Space Melody. This melody apparently was so popular that it somebody dedicated a whole track to it, also in 2020: Space Melody Resurrection. The melody in isolation starts at minute 2:45.
After listening to it for a bunch of times, I thought that the melody sounded rather simple. I haven't played the piano since I was in elementary school, and I never was good enough that I had enough joy while playing to play more often. Eventually I quit, and only listened to music from then on. But this melody sounded simple enough to make me think whether I could learn it on the piano. Problem is that I don't have a sheet of notes for that melody. One could perhaps somehow procure it, but I had something else in mind.
This is the most unmusical thing about music that I could think of. A musician would likely just listen to the track, try it out on a piano and eventually figure it out. But I have no practice in figuring out the pitch, and can work well with visualizations, text or equations. But sound just isn't my thing, I'd say. So I rather use the computer to figure out the frequencies which are contained there.
Loading the recording
First of all I needed to procure a recording of this tune. I just needed one loop of the melody, that is like 10 seconds. And that was easy to do with the loopback device. Eventually I got this recording in Audacity:
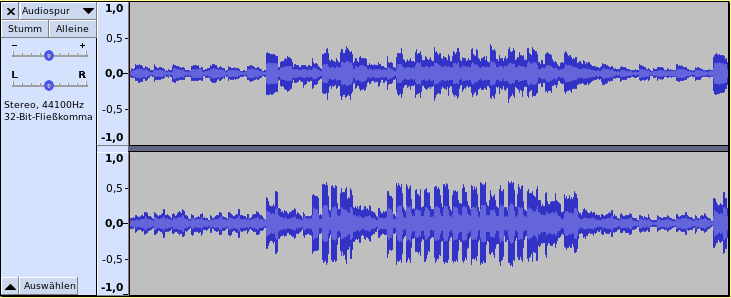
I have saved this as a wave audio file such that I can easily import that with SciPy in the next step.
Spectrogram
Using this I can create a spectrogram of one of the channels. To get the frequencies, I apply a Fourier transform in the form of the fast Fourier transform (FFT). One has to play a little with the FFT window size because one has to trade resolution in frequency and time. Incidentally this is the same principle behind Heisenberg's uncertainty principle which says that one cannot measure location and speed of a quantum particle to arbitrary accuracy. The same is here, the more exact I want the frequency, I have to let go of the information of when exactly it was played.
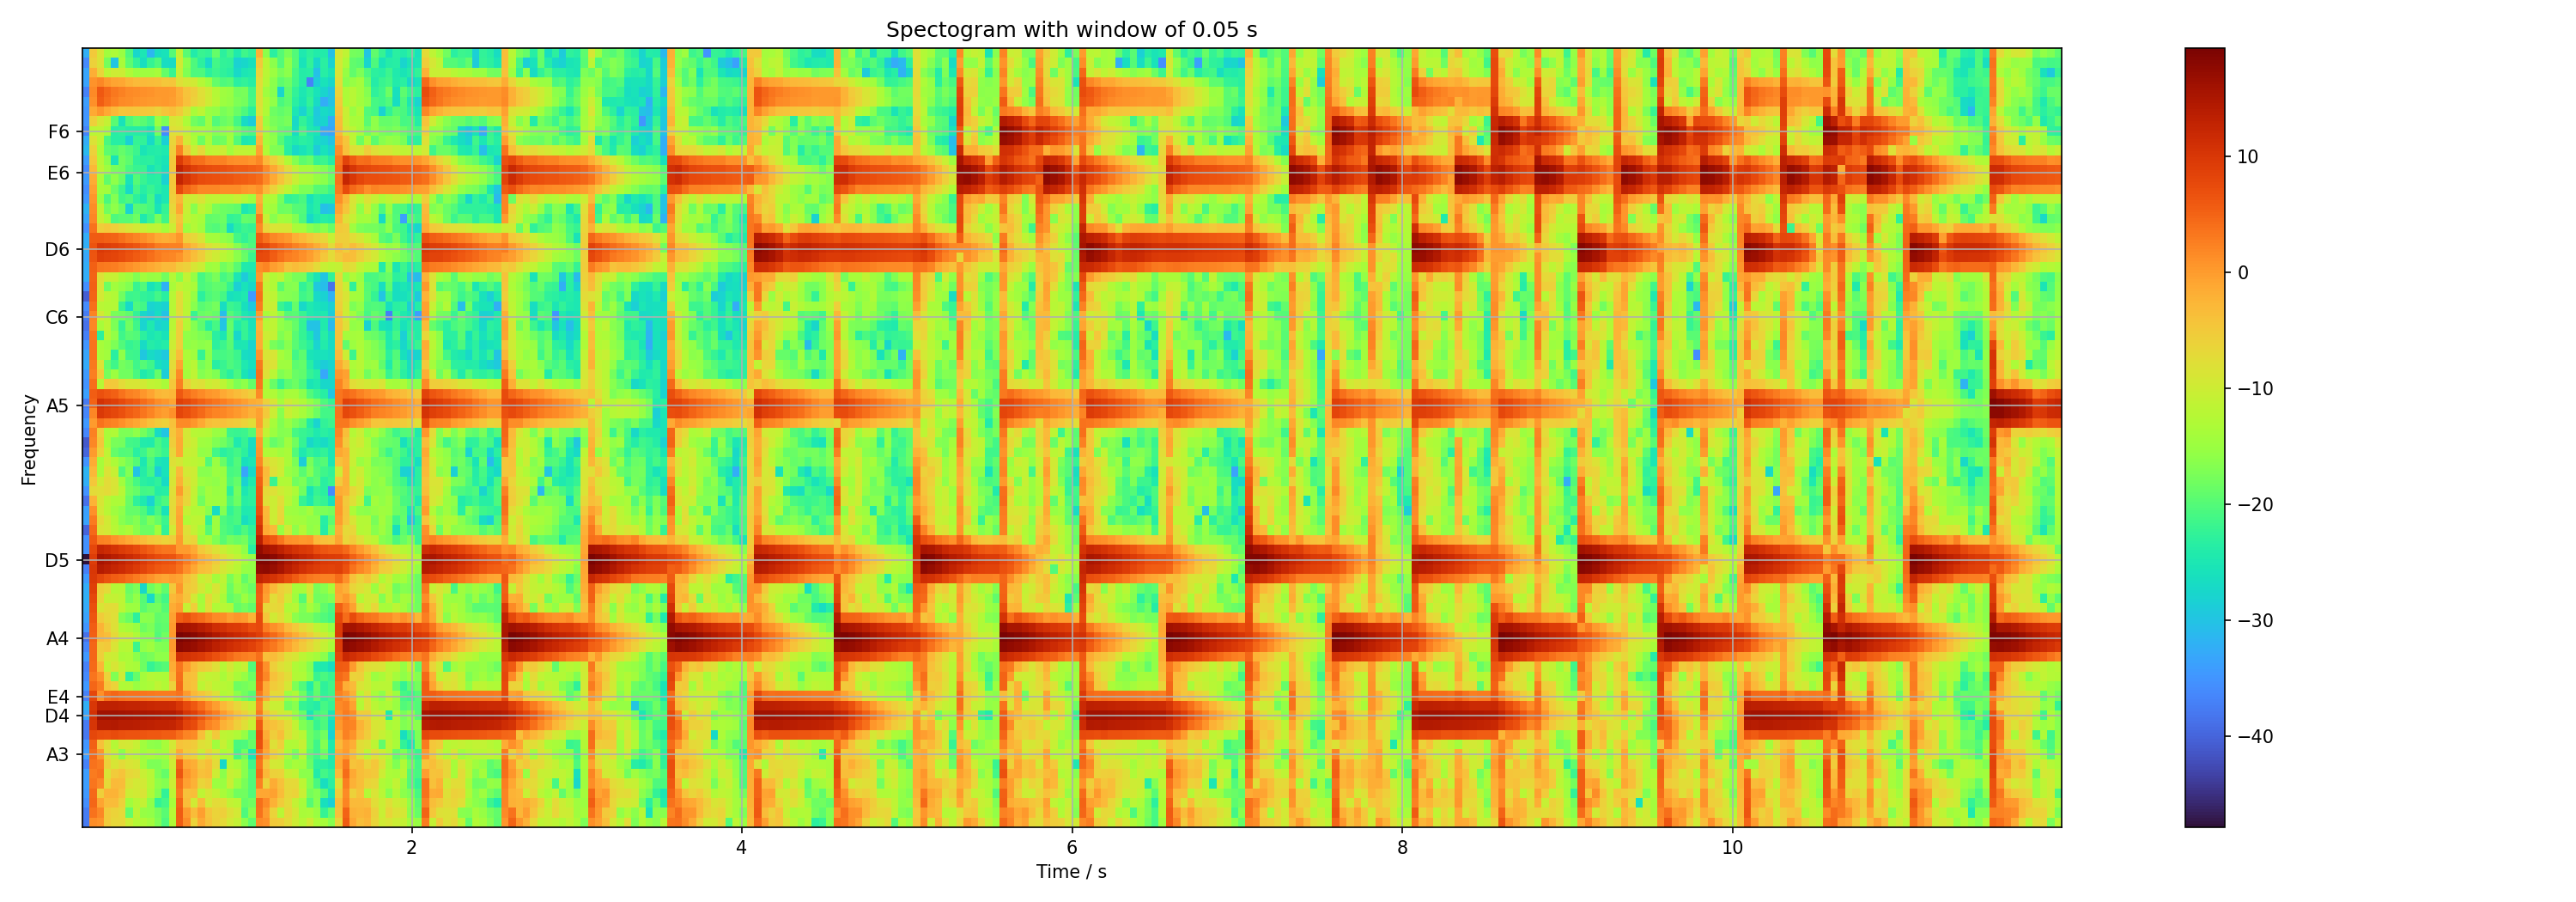
The result of operation can be visualized with a heat map like the following. You have time going from left to right. The frequencies are from bottom to top, from lowest to highest frequencies. The color coding gives the amplitude in dB, which corresponds to perceived loudness, red means the loudest.
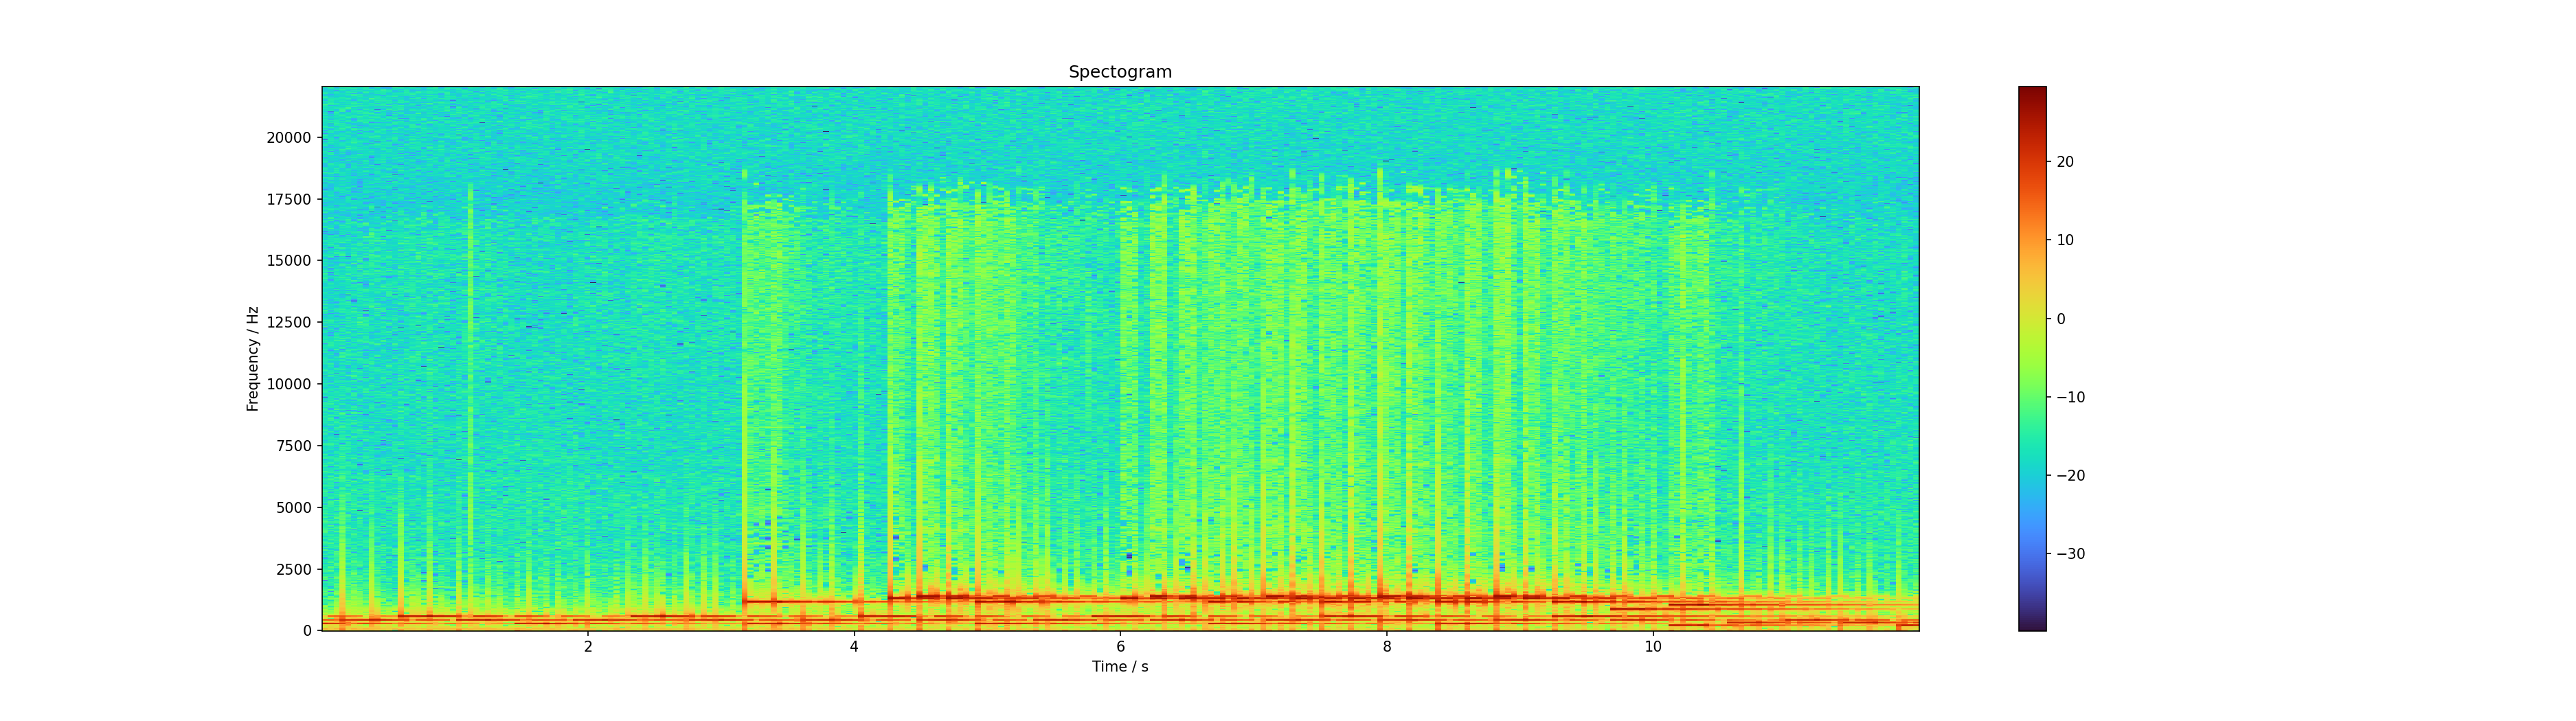
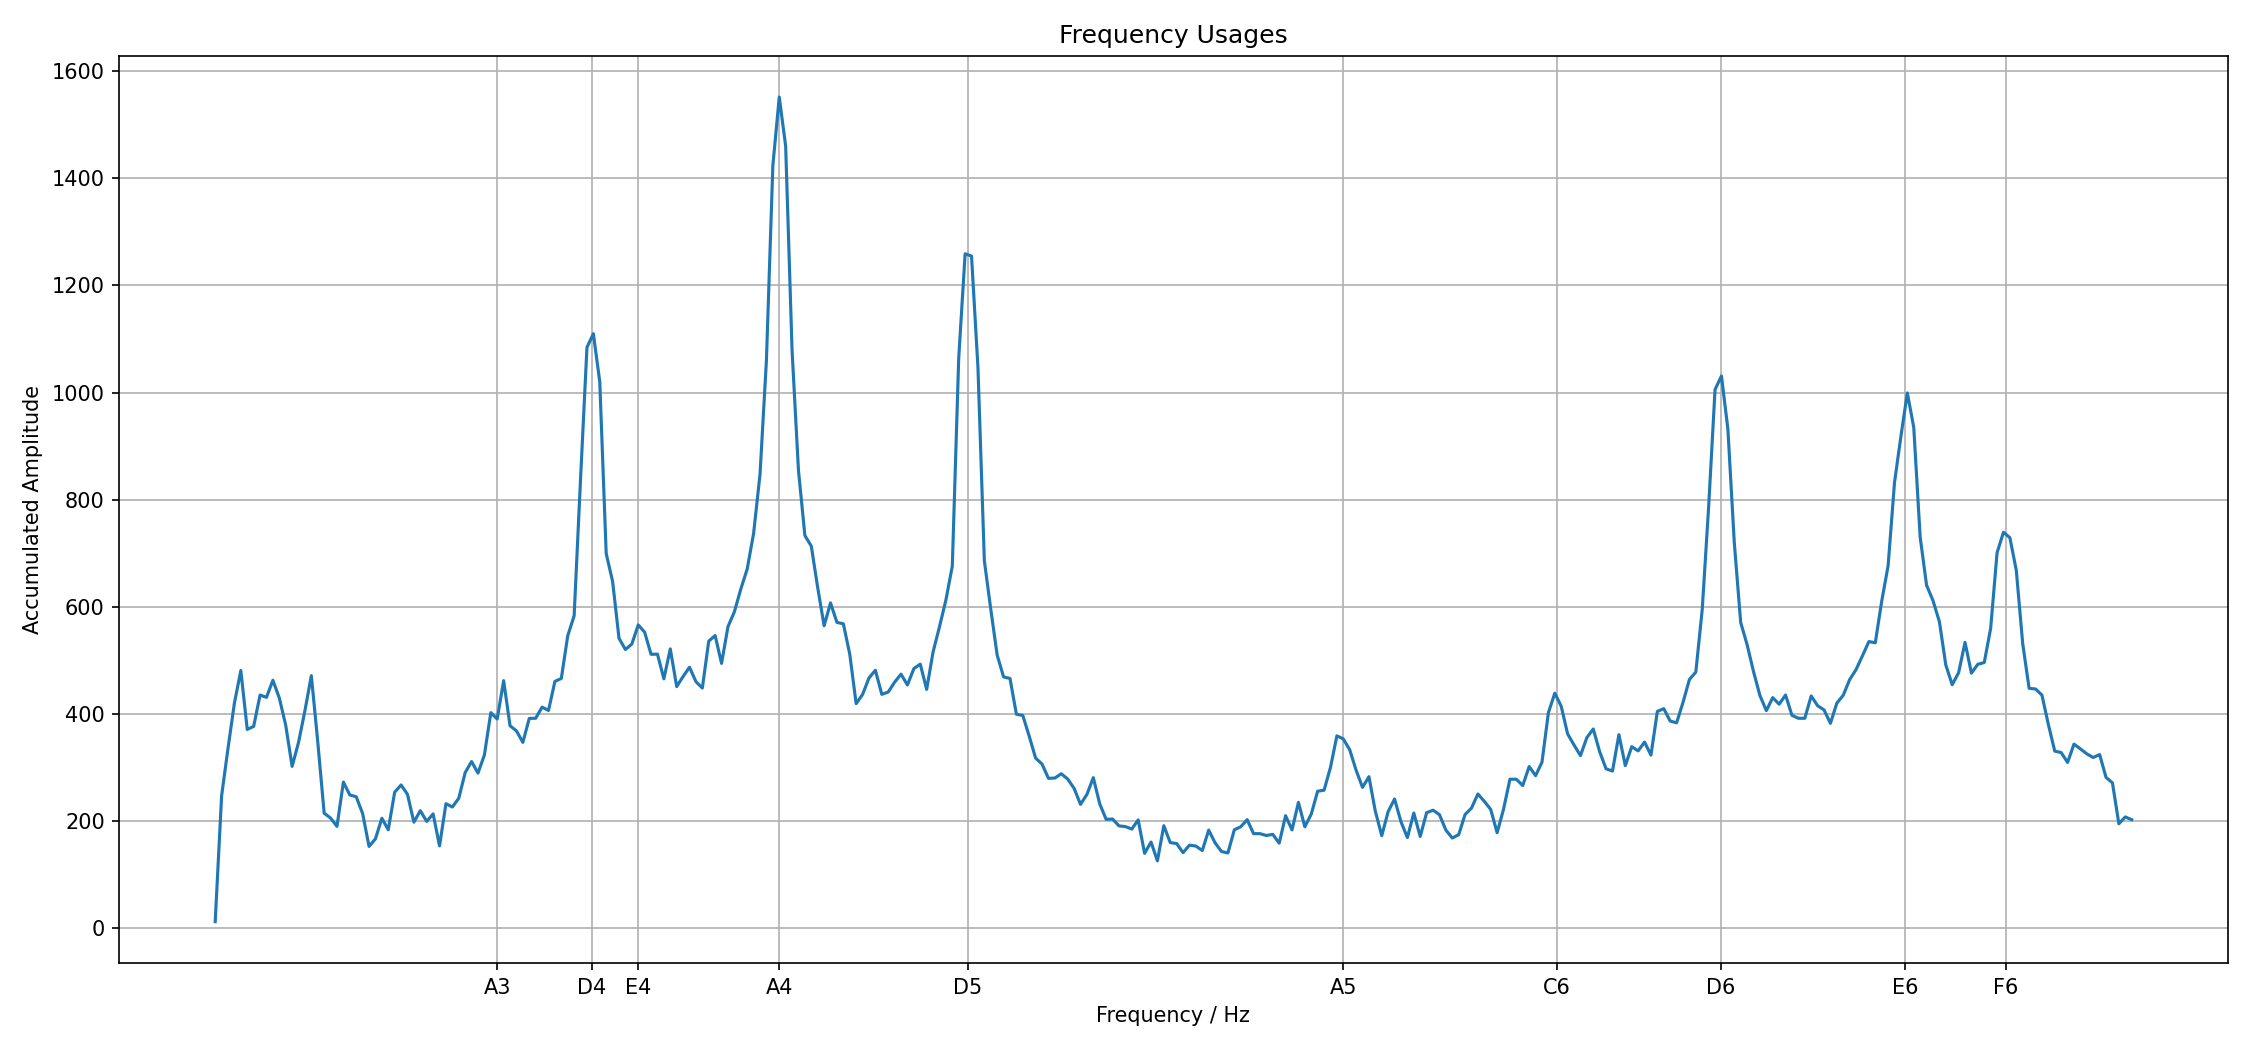
We can already see that most interesting things happen below 1500 Hz. I accumulate the amplitudes over the time region that I look into. The units of that quantity are meaningless, but it allows us to see which notes are used often. Music doesn't consist of just a few pure sine tones, but the tones have color, there are other frequencies which lets one for instance differentiate between an A₄ played on a piano from a violin. The major contribution will still be the 440 Hz. With this in mind, one can find the peaks in this diagram:

This diagram makes sense scientifically, there are frequencies on the axis. We can figure out which frequencies are used. But from the musician perspective it is pretty useless. Rather it makes sense to figure out which notes correspond to these peaks.
Translation to notes
The equal-tempered scale allows a mapping, see for instance this table. It has a rather rather straightforward connection between notes and frequencies, namely $$ f(n) = 440 \, \text{Hz} \cdot a^n \,, $$ where $n$ is the number of half-steps away from A₄ and $a = \sqrt[12]{2}$ is the frequency stepping. There are 12 half-steps per octave, and an octave is a frequency doubling. Therefore we get this coefficient $a$ like that. And the base frequency of the A₄ is 440 Hz. From this one can compute all other notes.
I have fiddled around with the peaks until I found matches. This allows us to relabel the above graph to make it more meaningful.
Spectrogram with notes
We can then use the mapping from frequencies to notes and create a more useful version of the spectrogram which is labeled with the notes which are used in the melody. There are gray grid lines which help. The temporal resolution isn't perfect, but one can get an idea of what is going on. There is a bass tune with just three different notes (D₄, A₄ and D₅) in the beginning. A few bars later we have the melody with D₆, E₆ and F₆. At the end of the theme we have A₅ and C₆ in the higher sounds, and A₃ and E₄ in the bass.
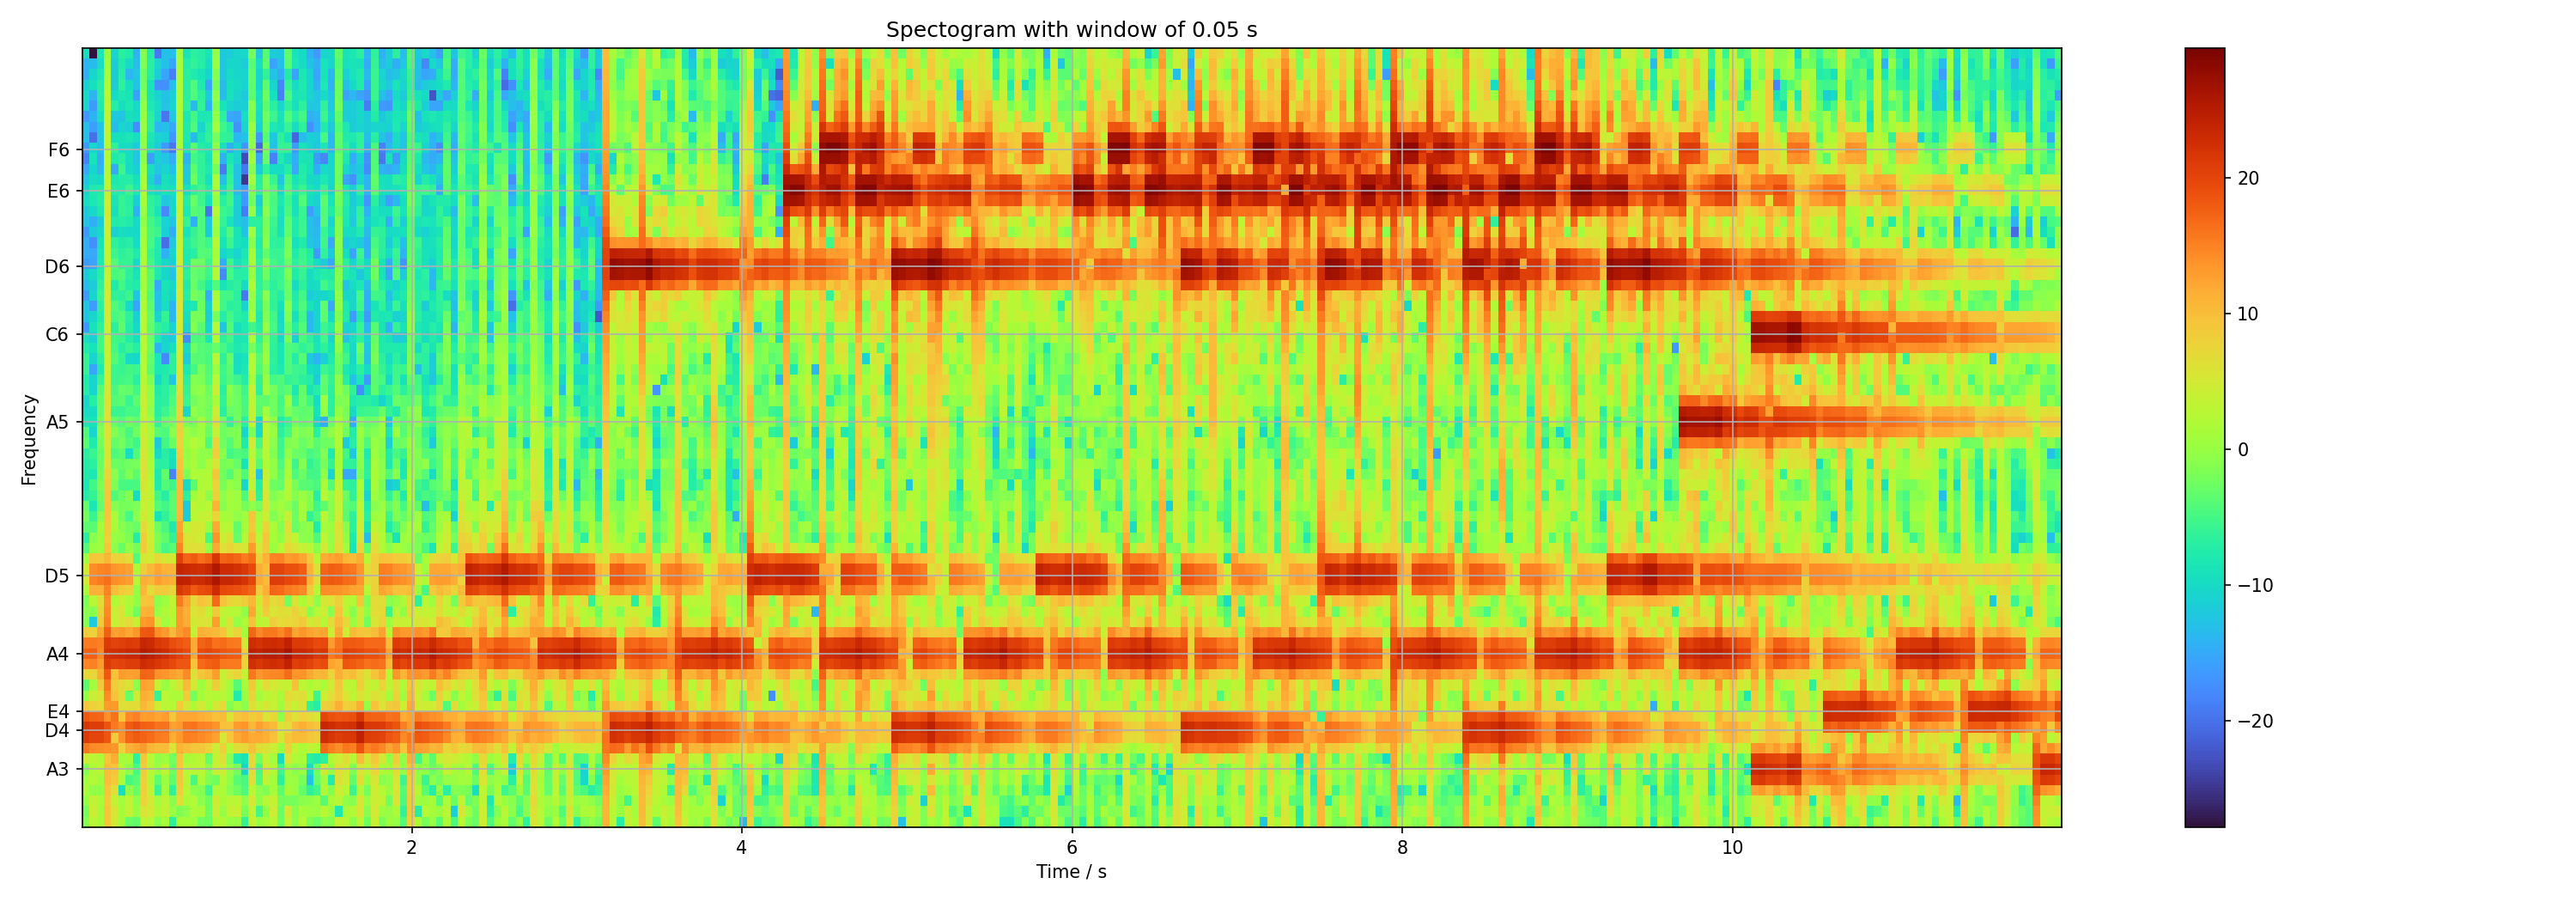
I consider this to be similar to a sheet of notes. On such a sheet there are pure notes, in a very abstract way. The spectrogram shows the actual sounds with a concrete instrument. This will look different for every instrument that this melody will be played on.
Towards a sheet of notes
Since we now have figured out which tunes occur in this melody, we can just look at the temporal evolution of these few frequencies. There are five frequencies in the lower and higher frequencies. I have already split them into two graphs because I will have to play them with two hands on the piano. The graphs show the amplitude for each frequency.
There is a lot of noise in there, so in the upper half I'd ignore everything below 25 dB, in the lower graph everything below 22 dB. Perhaps start looking at the lower graph. It just shows the background with four beats per bar, namely D₄, A₄, D₅, A₄, repeated over and over again. One can see the note being played and then fading away.
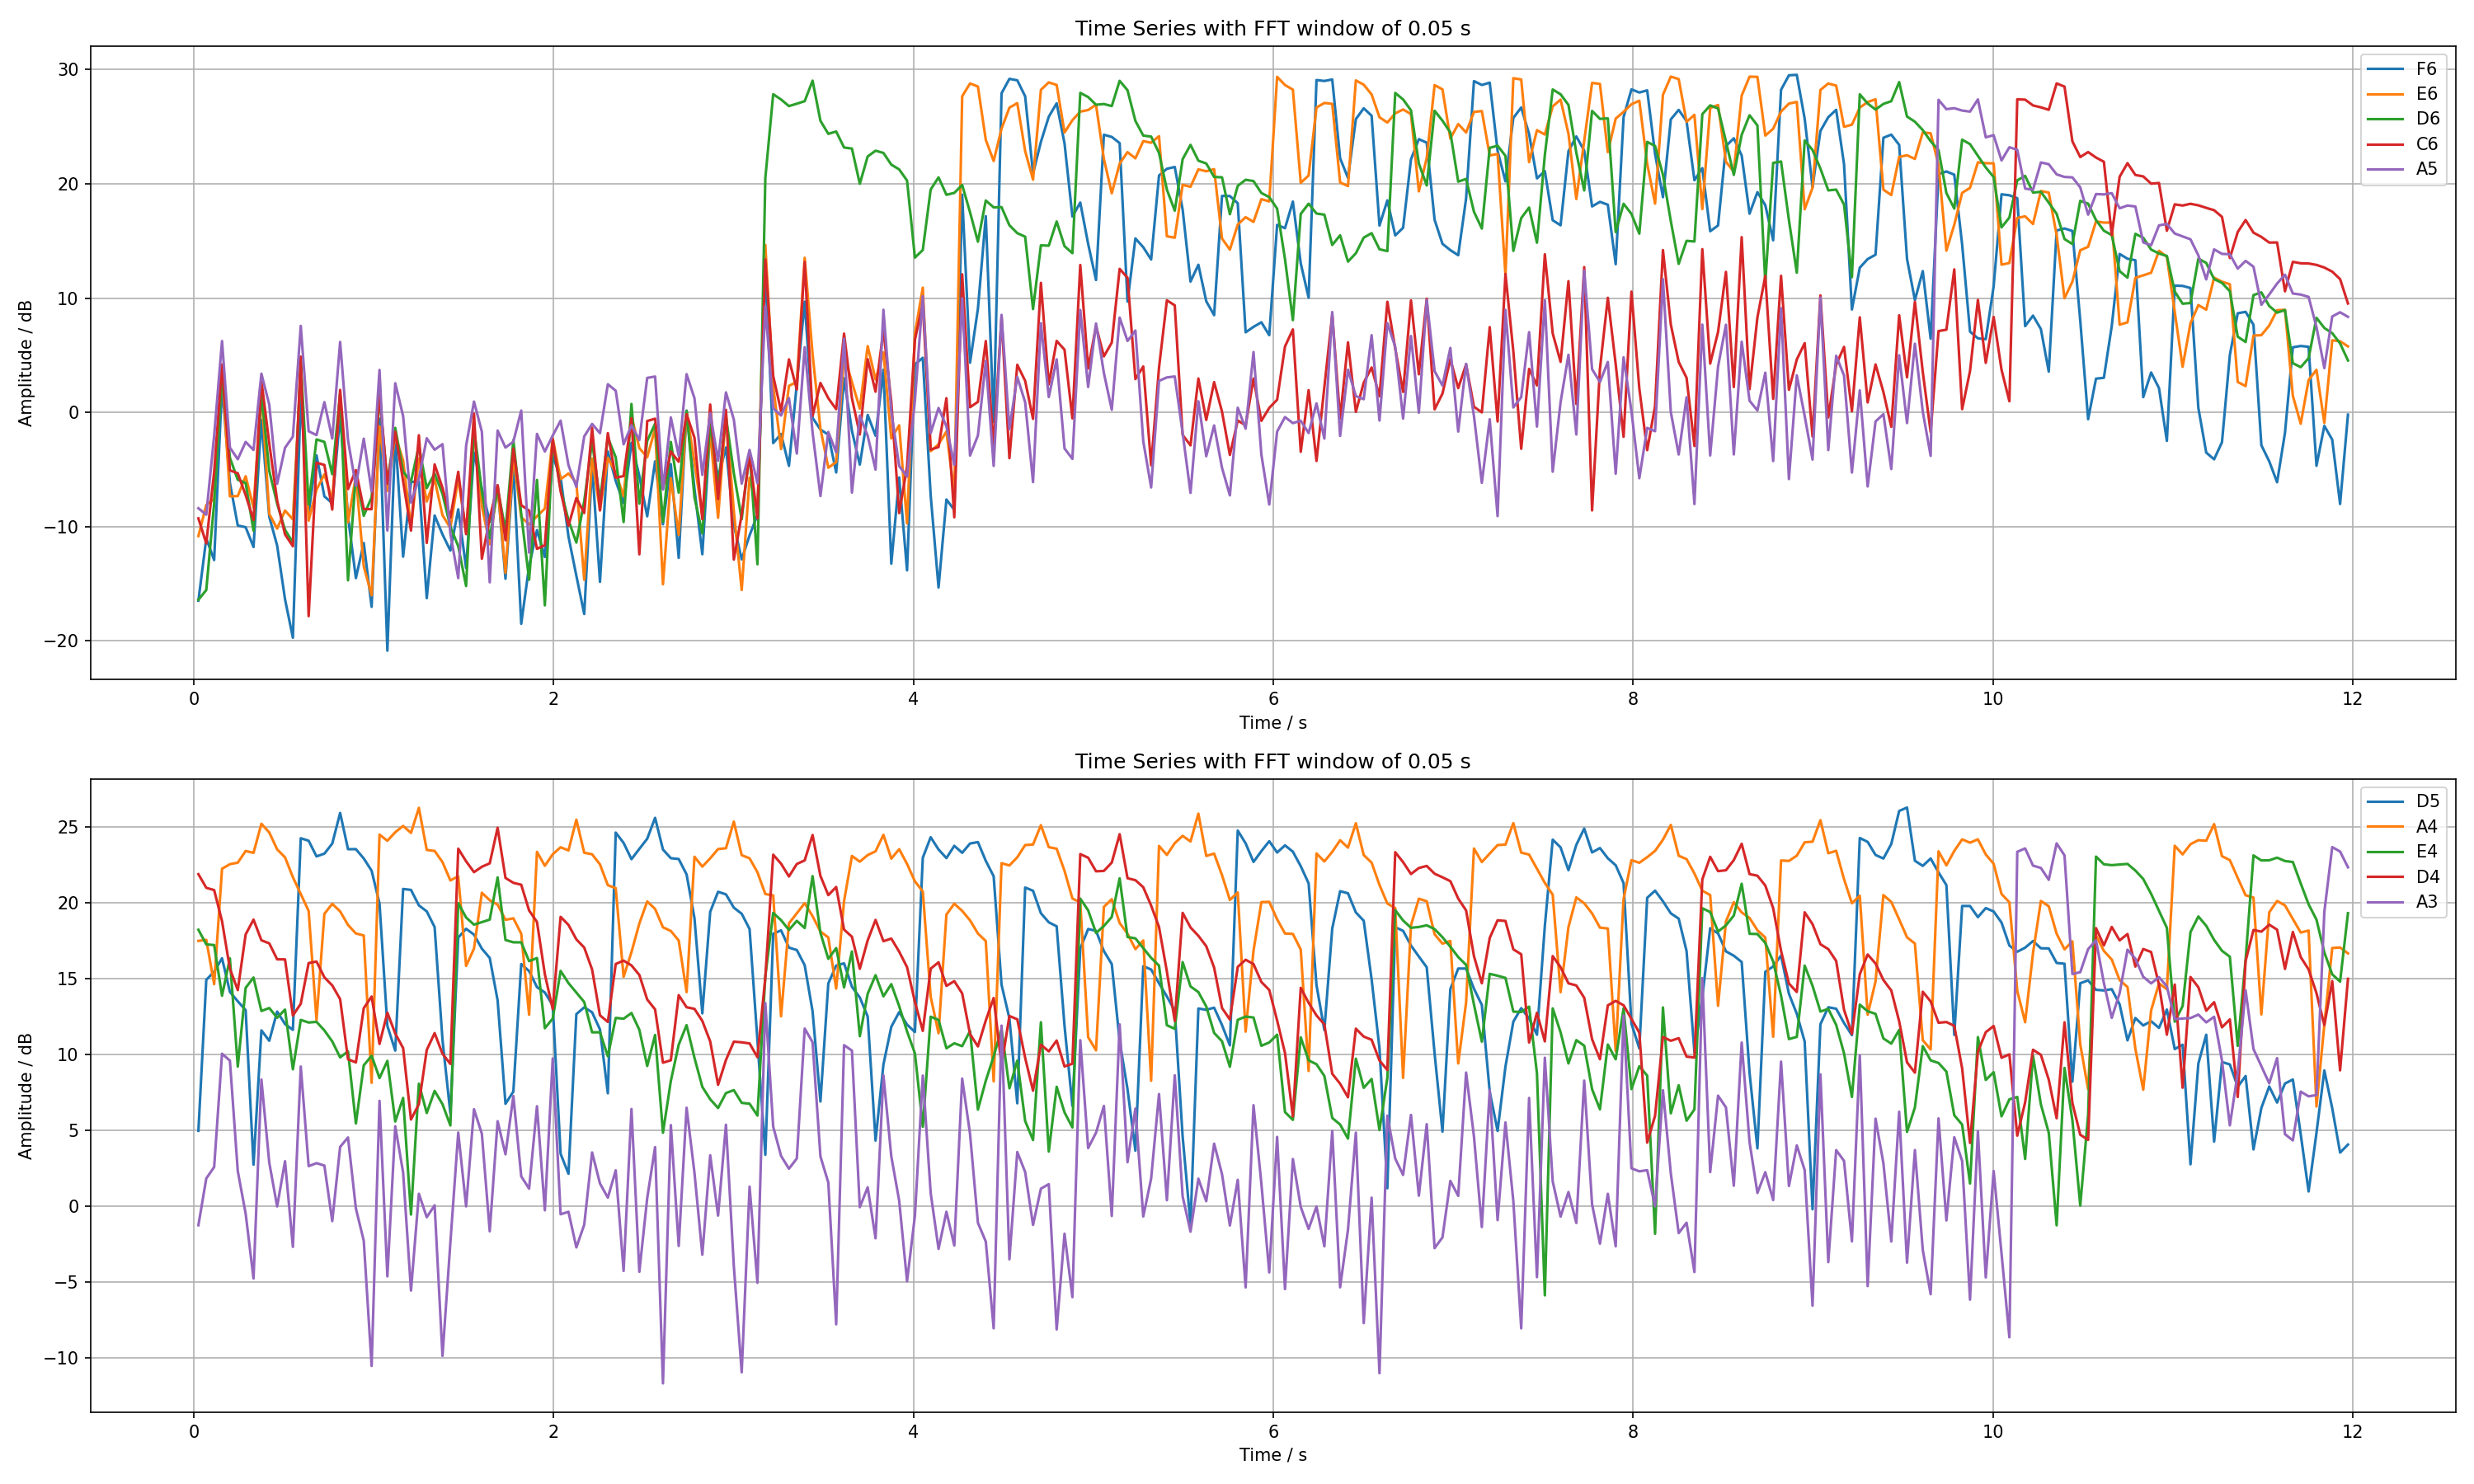
In the upper half we see silence, and then a ⅝ beat long D₆. The next bar begins with a ⅛ of E₆, another ⅛ F₆ and a ⅛ E₆. Then the next bar begins with another longer D₆. One has to match the timings from the lower and upper half to make out the beat and the bars.
I've then used Denemo to construct a sheet of music from that.
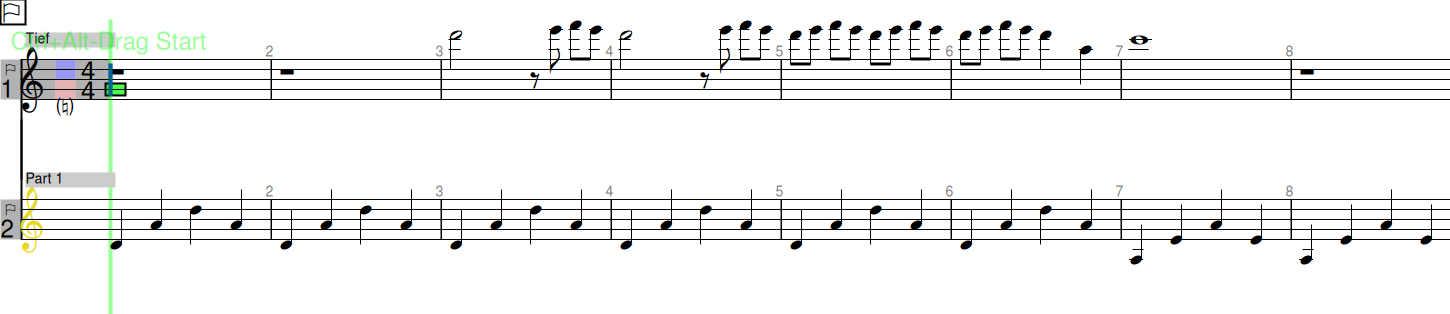
I cannot read the notes, but the program lets me just enter it with letters and the vague knowledge that I retained, it looks plausible.
Synthesizing the notes
The program can also play this on a virtual piano, and the melody sounds quite the same:
I am quite happy with that, to me it sounds like the original melody!
And we can look at the spectrogram of the generated sound so see how that compares to the original. I somehow had to scale the frequencies with a factor of 0.92 to make the frequencies line up. So perhaps I had some setting incorrectly in Denemo and it used a reference of around 405 Hz for the A₄. With that fudging I get this:
It looks really strange on the first glance, but there are just a lot of higher orders in there. I've circled all the base notes in the following:
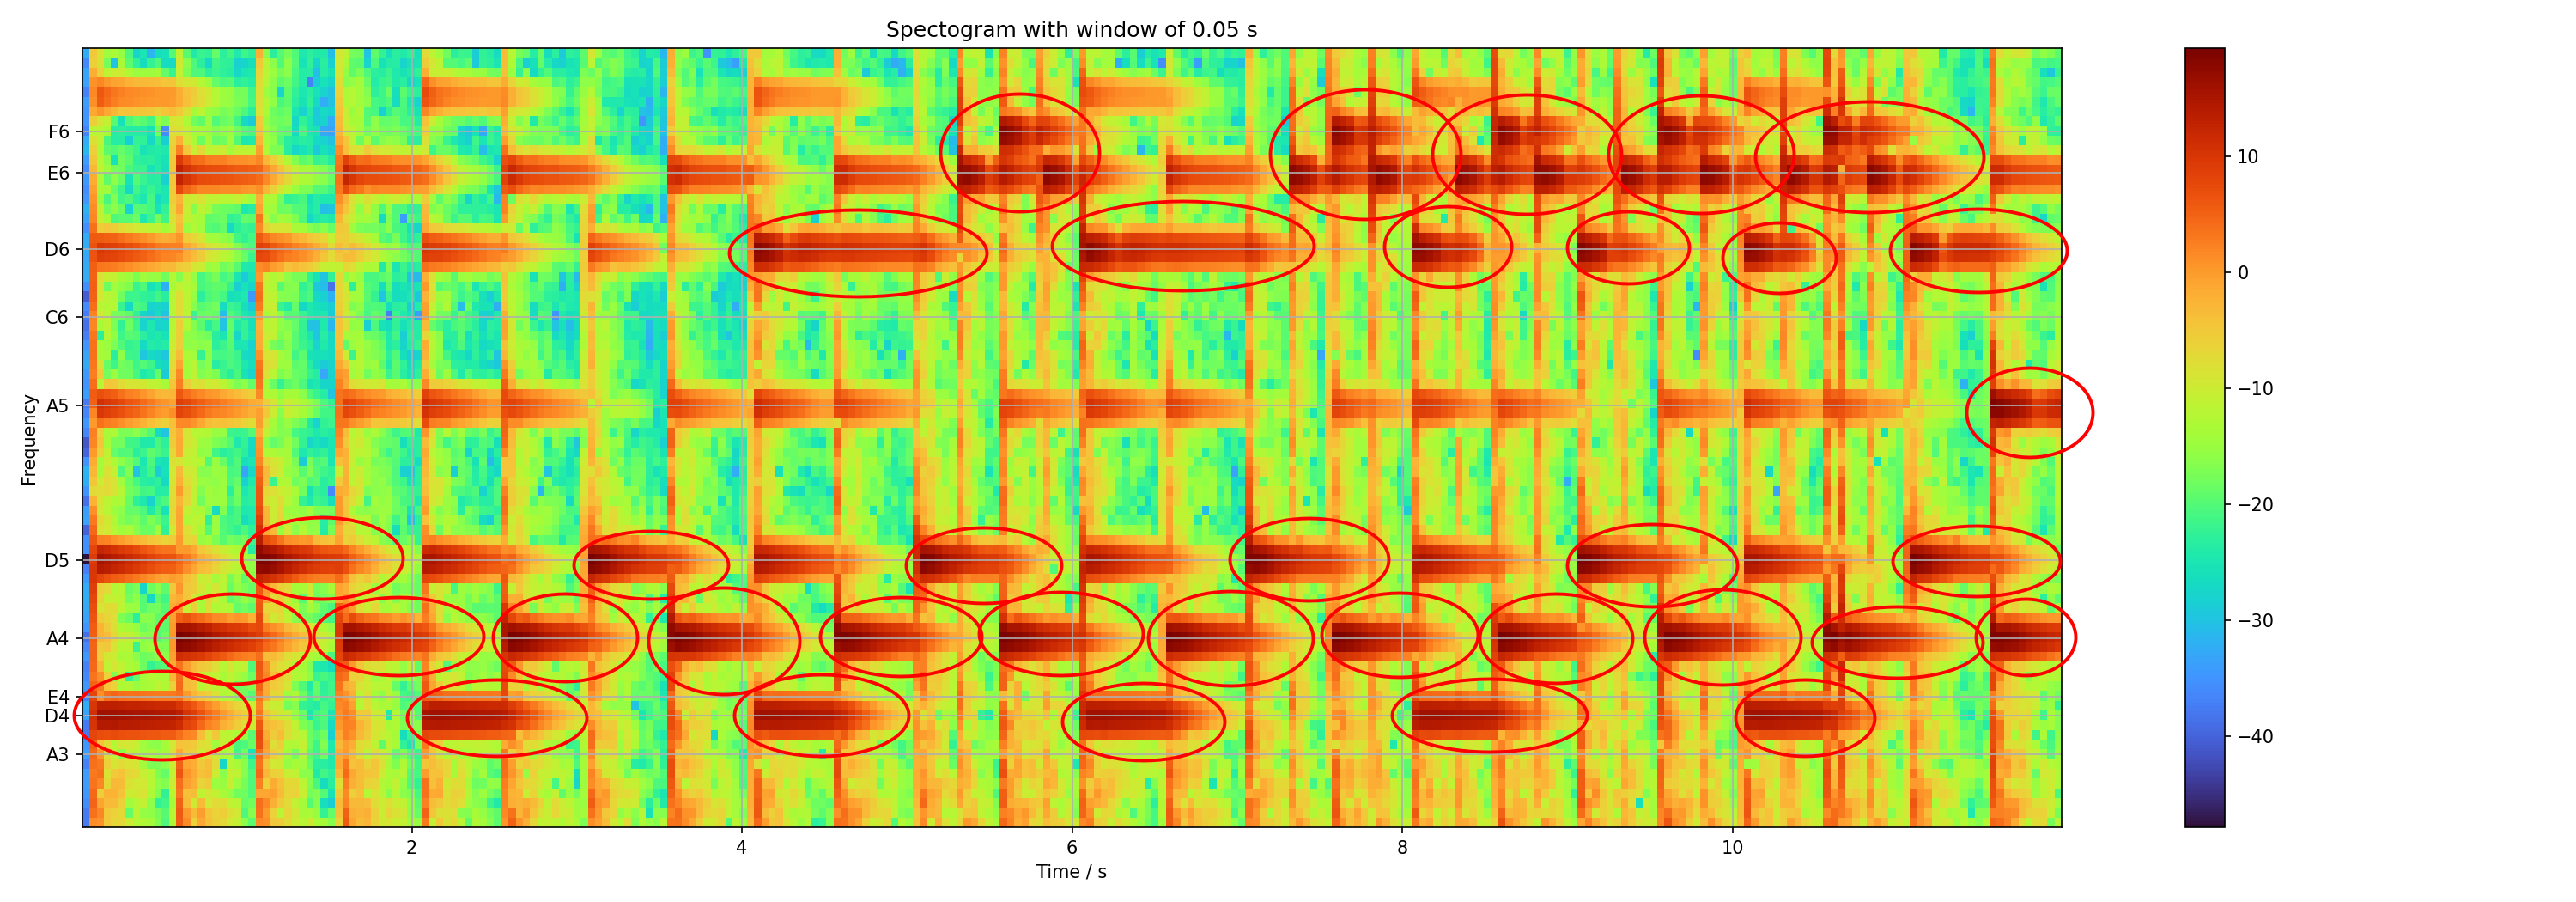
This is the same pattern that one can see in the sheet of notes and the original spectrogram. The additional come from the (simulated) vibrating string. The lowest one is the frequency $f$ that is actually played, the other ones are $2f$, $3f$ and so on. The base is the D₄. The frequency doubling is just one octave higher, the D₅. But the tripling gives A♭₅ (or G♯₅?), and not exactly the A₅. I am not sure what that means, and whether it adds or distracts the harmonics of the melody.
Comparison with official notes
In the end I was curious and looked for the official notes. Turns out that one can buy them online (alternative store).
Looking at the first line it seems that I have figured it out pretty much. I wasn't familiar with that arc notation, but it basically means to hold the note for ½ + ⅛ = ⅝. My notation with the ⅛ break is just wrong. And I missed the chord at the end, and only have the upper of the two notes.
Conclusion
I've learned a bit about music again, which is nice. And after listening to the melody dozens of times, I still cannot really identify the notes that I see with what I hear. I'll have to try it on the piano to see whether I really grasp it or not.
And I will likely just buy the notes from one of the stores instead of trying to reverse engineer the remainder of the track. I've seen that it works somewhat in principle, but there are some errors, especially with the chords. Therefore it is easiest to just take the original instead of reverse engineering it.